Cumulative probabilities for action rolls

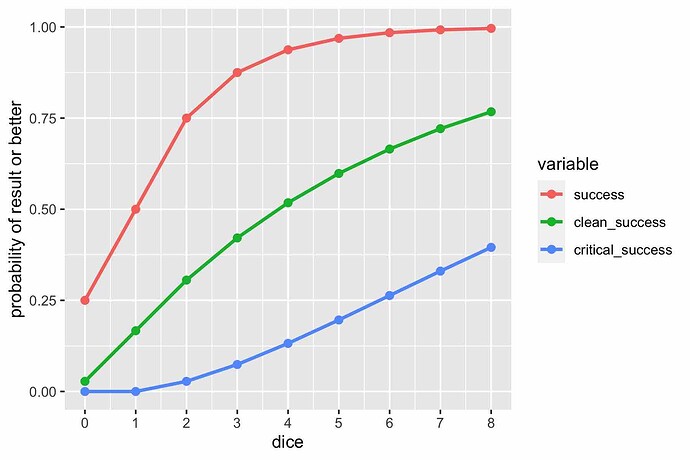
Here’s a table of cumulative probabilities of rolling a partial success or better (4-5+), rolling a clean success or better (6+), and of rolling a critical success (66, representing two 6s in the dice pool).

 dice   4-5+     6+     66
    0  0.250  0.028  0.000
    1  0.500  0.167  0.000
    2  0.750  0.306  0.028
    3  0.875  0.421  0.074
    4  0.938  0.518  0.132
    5  0.969  0.598  0.196
    6  0.984  0.665  0.263
    7  0.992  0.721  0.330
    8  0.996  0.767  0.395

With six dice, the clean success probability is a nearly 2/3 and the outright failure rate is under 1/60.

Here’s a plot of the same data.

The main takeaway is that each additional die halves the chance of failure, which is 1 minus the probability of rolling 4-5 or better. In a desperate situation where the crew’s outmatched, it makes a lot of sense to take the stress and/or devil’s bargain for another die to cut the probability of failure in half. The chance of a clean success or better goes up much more slowly, with the value (1 - 5/6^N) vs. (1 - 1/2^N) for a success or better. Both ways, the rate of failure decay is exponential.

I originally published this analysis in a comment on a blog post, Probabilities for action and resistance in Blades in the Dark. I’m a computational statistician by day, RPG-er by night. That includes the actual probabilities of different resistance rolls vs. dice pool. I should probably put that into a cumulative plot, too, so that players can easily assess the probabilty of overindulging their vice (as both my players’ characters did out of the gate because they had at least 1 dot in every attribute trying to cover all the bases as a two-man crew).

Here’s some crude R code to generate the plots and table. My excuse is that I’m a C++ programmer, not an R programmer. It’s probably possible to do this via AnyDice, but I don’t know their language. The dynamic programming algorithm to compute the probabilities was cribbed from Bouke van der Spoel’s comment on my original blog post. The recursion neatly illustrates how adding one more die updates the probabilities. It also illustrates how the failure rates drop exponentially because of the multiplications.

library('ggplot2')
library('reshape')

res <- matrix(NA, nrow = 8, ncol = 4)

# 1-8 dice case with base case followed by recursion
res[1, 1:4] <- c(3/6, 2/6, 1/6, 0)
for (n in 2:8) {
  res[n, 1:4] <- c(res[n - 1, 1] * 3/6,
                   res[n - 1, 1] * 2/6 + res[n - 1, 2] * 5/6,
                   res[n - 1, 1] * 1/6 + res[n - 1, 2] * 1/6 + res[n - 1, 3] * 5/6,
                   res[n - 1, 3] * 1/6 + res[n - 1, 4])
               }

# bind in special case for 0 dice, now indexed 1-9
cumulative_df <-
  rbind(data.frame(success = 1/4, clean_success = 1/36, critical_success = 0),
        data.frame(success = res[ , 2] + res[ , 3] + res[ , 4],
                   clean_success = res[ , 3] + res[ , 4],
                   critical_success = res[ , 4]))

# convert to long form for plotting using reshape::melt, add number of dice values
long_df <- cbind(dice = c(0:8, 0:8, 0:8), melt(cumulative_df))

# generate plot and save as jpg
plot <- ggplot(long_df, aes(x = dice, y = value, colour = variable)) +
  geom_point(size = 2) +
  geom_line(size = 1) +
  ylab("probability of result or better") +
  scale_x_continuous(breaks = 0:8) +
  scale_y_continuous(breaks = c(0, 0.25, 0.5, 0.75, 1.0),
                     lim = c(0, 1))
ggsave('bidt-cumulative-action-probs.jpg', width = 7, height = 4)

# print table with 3 decimal places of accuracy
cat(sprintf("%5s  %5s  %5s  %5s\n", "dice", "4-5+", "6+", "66"))
for (n in 1:9)
  cat(sprintf("%5d  %5.3f  %5.3f  %5.3f\n", n - 1,
              cumulative_df[n, 1], cumulative_df[n, 2], cumulative_df[n, 3]))
5 Likes

Hey, thanks for the work! Always cool to see things under the prism of probabilities.

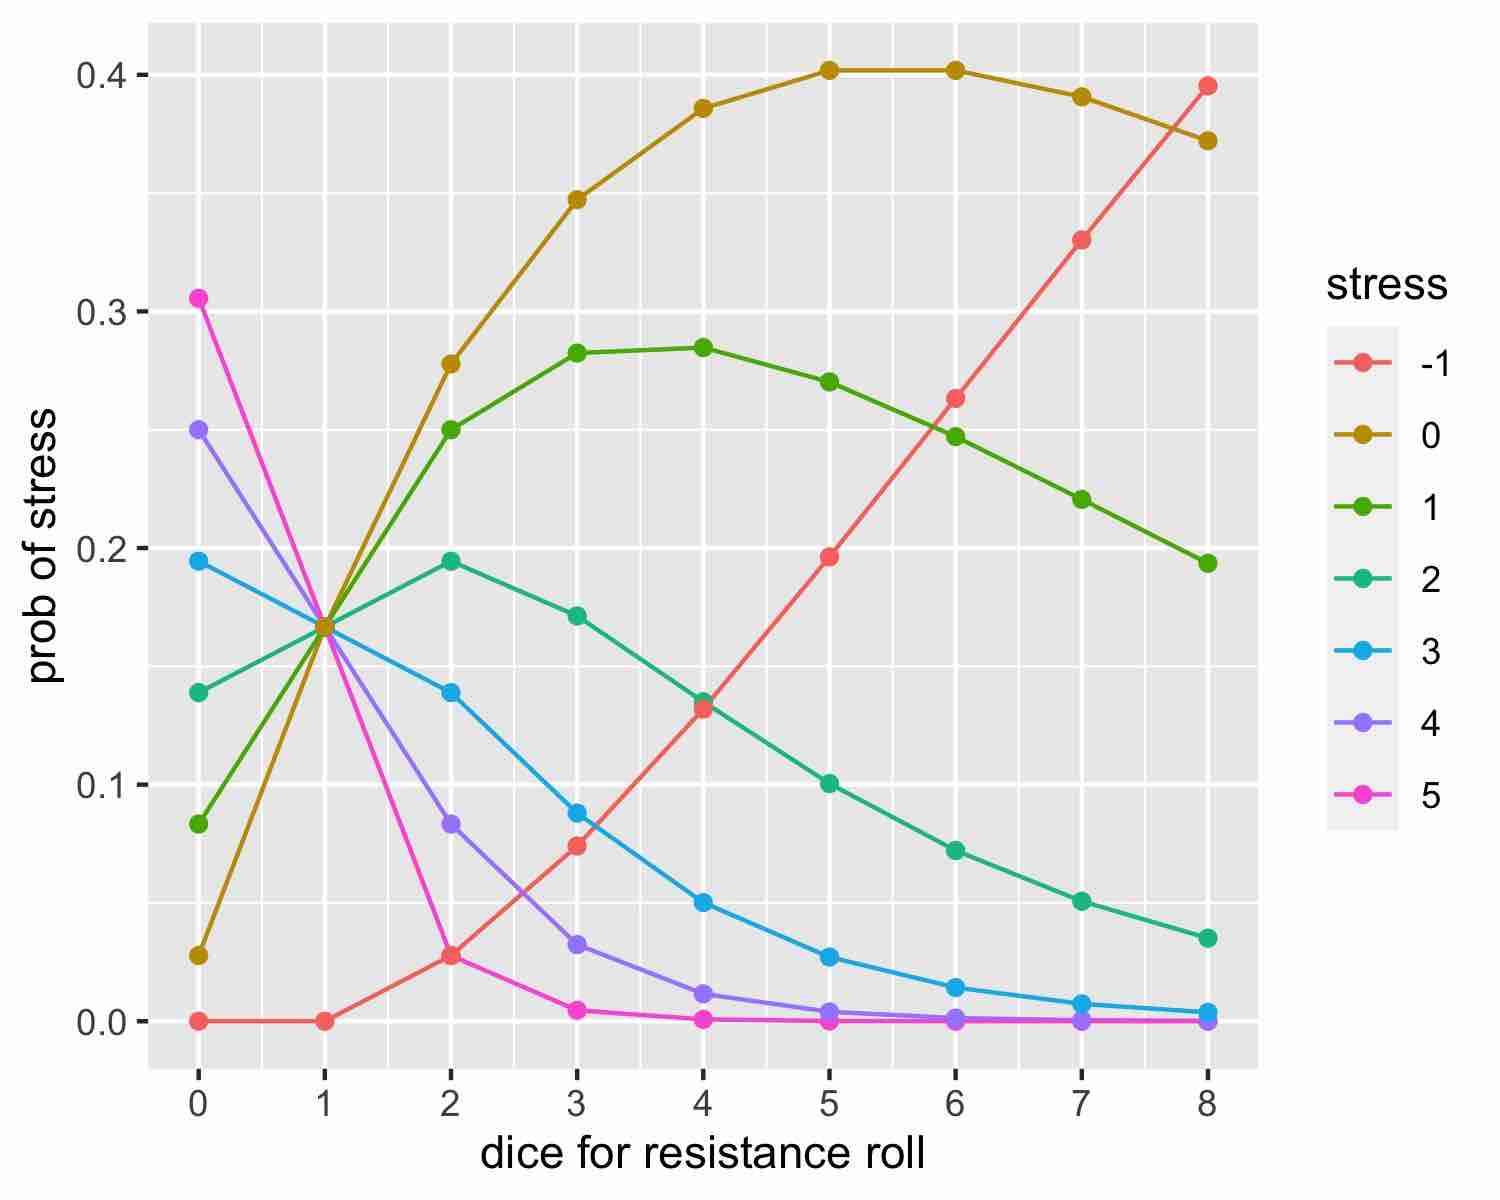
Here’s the table of probabilities for paying a given level of stress for a given size of dice pool.

                 Stress cost
Dice    5    4    3    2    1    0   -1
   0  .31  .25  .19  .14  .08  .03  .00 
   1  .17  .17  .17  .17  .17  .17  .00
   2  .03  .08  .14  .19  .25  .28  .03
   3  .00  .03  .09  .17  .28  .35  .07
   4  .00  .01  .05  .13  .28  .39  .13
   5  .00  .00  .03  .10  .27  .40  .20
   6  .00  .00  .01  .07  .25  .40  .26
   7  .00  .00  .01  .05  .22  .39  .33
   8  .00  .00  .00  .03  .19  .37  .40

In a resistance roll, you get a number of dice (usually maxing out at 4, the number of actions per attribute) and take the highest roll. The amount of stress the character takes is equal to 6 minus the result. So if you roll a 6, you resist without taking any stress, so it’s a 0 stress result; if the highest die is a 4, the character takes 2 stress for resisting. A critical success (two 6s in the dice pool) means you get one stress back (a -1 stress result). Thus the cost in stress for resistance will be between -1 (dice pool result of two 6s) and 5 (dice pool result of 1) .

The first plot is the probability of the individual stress costs, as given in the table above. It looks strange because with 1 die, results 0–5 all have the same probability (1/6), whereas with 0 dice (disadvantage) they’re skewed toward high stress and with 2 dice (advantage), they’re skewed low.

I only get one plot per post as a new user, so I’ll have to break this up.

OK, breaking into second reply to comply with one image/post limit. Ack. Now Discourse (the software running this forum) is griping that I’m replying too quickly. Hope I killed enough time griping about Discourse griping that it’ll let me post. I’m used to being an admin on our open-source software project’s Discourse server.

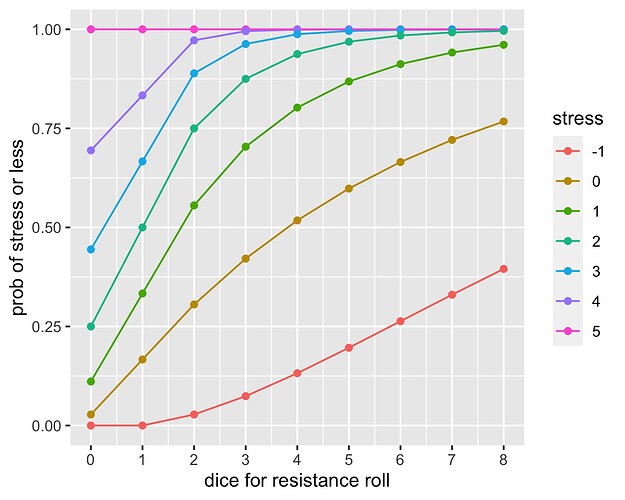
The second plot is the cumulative probability of paying a given amount of stress or less. For example, the probability of paying 1 stress or less to resist is given by the bright green line and it goes from about 10% with 0 dice to 33% with one die (roll of 5 or 6) to over 50% with two dice. That is, with two dice, there’s a greater than 50% chance that the stress cost will be 1 or 0 or -1.

Here’s the R code.

# row = dice, col = outcome
resist <- matrix(0, nrow = 8, ncol = 7)
resist[1, 1:6] <- 1/6
for (d in 2:8) {
  for (result in 1:5) {
    resist[d, result] <-
      sum(resist[d - 1, 1:result]) * 1/6 +
      resist[d - 1, result] *  (result -1) / 6
  }
  resist[d, 6] <- sum(resist[d - 1, 1:5]) * 1/6 +
                  sum(resist[d - 1, 6]) * 5/6
  resist[d, 7] <- resist[d - 1, 7] + resist[d - 1, 6] * 1/6
}

cumulative_resist <- resist  # just for sizing
for (d in 1:8) {
  for (result in 1:7) {
    cumulative_resist[d, result] <- sum(resist[d, result:7])
  }
}

library('reshape')
library('ggplot2')


zero_dice_probs <-  c(11, 9, 7, 5, 3, 1, 0) / 36
zero_dice_cumulative_probs <- zero_dice_probs
for (n in 1:7)
  zero_dice_cumulative_probs[n] <- sum(zero_dice_probs[n:7])

z <- melt(cumulative_resist)  # X1 = dice, X2 = result, value = prob
stress <- 6 - z$X2
df <- data.frame(dice = z$X1, stress = as.factor(stress), prob = z$value)
df <- rbind(df, data.frame(dice = rep(0, 7), stress = as.factor(6 - 1:7), prob = zero_dice_cumulative_probs))

cumulative_plot <- ggplot(df, aes(x = dice, y = prob,
                   colour = stress, group = stress)) +
  geom_line() + geom_point() +
  xlab("dice for resistance roll") +
  ylab("prob of stress or less") +
  scale_x_continuous(breaks = 0:8)
cumulative_plot
ggsave('cumulative-resistance.jpg', plot = cumulative_plot, width = 5, height = 4)


z2 <- melt(resist)  # X1 = dice, X2 = result, value = prob
stress2 <- 6 - z2$X2
df2 <- data.frame(dice = z2$X1, stress = as.factor(stress2), prob = z2$value)
df2 <- rbind(df2, data.frame(dice = rep(0, 7), stress = as.factor(6 - 1:7),
                             prob = zero_dice_probs))

plot <- ggplot(df2, aes(x = dice, y = prob,
               colour = stress, group = stress)) +
  geom_line() + geom_point() +
  xlab("dice for resistance roll") +
  ylab("prob of stress") +
  scale_x_continuous(breaks = 0:8)
plot
ggsave('resistance.jpg', plot = plot, width = 5, height = 4)

my players do always joke about resistance being “free” (they like getting high dice pools on that stuff), and this certainly puts that in perspective! awesome work, i love seeing this under-the-hood stuff.

Just watched this on Youtube - Matt Parker goes into some of the maths behind rolling multiple dice and taking the highest result. He also glues some dice together, creating a really good visualisation of the probabilities. The unexpected logic behind rolling multiple dice and picking the highest.

1 Like